PPC
Here, we’re going to introduce the production possibilities curve (PPC), a graphical representation of a firm or economy’s capacity for producing goods and services.
The main resources for production in economics are land, labor, capital, and entrepreneurship. Land refers to ALL natural resources used in production, so it includes materials like crude oil. Labor in economics has a more conventional definition; it just accounts for the time and effort put in by the labor force. Like that of land, the definition of capital in economics is not the traditional financial definition. Capital is NOT money; instead, it is the man-made goods used in the production of other goods and services. A factory building and the machinery inside it are good examples of capital. Entrepreneurship is a less common term in economics, but it refers to HOW the resources for production are organized.
Now, the way that these resources are used depends on the type of economy they’re in. A market economy has limited government intervention, whereas a command economy has heavy government intervention. The degree of government intervention has significant implications on efficiency, innovation, and social welfare, but this course will focus primarily on market economies.
In an efficient economy, more of one good cannot be made without trading off with the production of another good. This means that there are no idle resources, resources for production that are not being fully used. Points B, D, and C in the image below are all efficient.
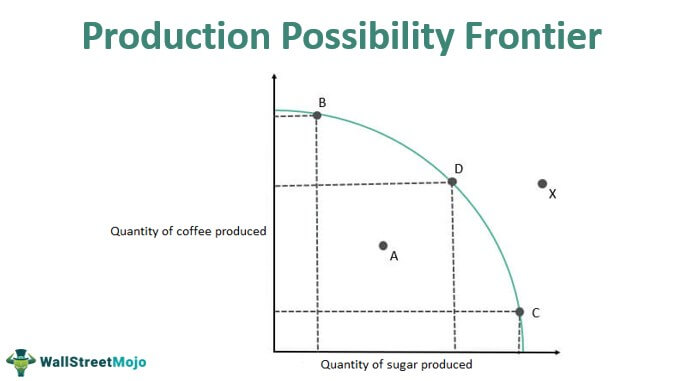
Source: WallStreetMojo
You might be wondering why the PPC has that bowed out shape. Why isn’t it just a straight line? Well, this relates to what we discussed earlier: diminishing returns. For each additional unit of sugar produced, we have to sacrifice a greater quantity of coffee. That is, the opportunity cost of moving from D to C is greater than that of B to D. Diminishing returns is tied directly to increasing opportunity cost. If the PPC was linear, that would mean opportunity costs are constant.
It’s also important to discuss points A and X. Any point inside the curve suggests that all resources are not being used efficiently: point A is an inefficient output. Maybe there’s high unemployment and people are idle. Point X, on the other hand, suggests that we are producing more than we’re capable of: this is an unsustainable output. It is technically possible to consume beyond the PPC when countries engage in trade, but we’ll talk more about that later.
The PPC is not permanent; it can shift depending on two factors. First, a change in the quantity or quality of the resources of production we discussed earlier. An example would be better training and education for workers. Second, technological advances, such as improved machinery that makes assembly lines more efficient.
Remember, the PPC is a measure of what CAN be produced, not what IS being produced, so something like a small hurricane that results in non-permanent damage to manufacturing plants wouldn’t shift the PPC inward, though it would likely change the specific point within the PPC that we’re producing at.