Cost Curves
The point of this section is for you to understand what cost curves look like and why they have the shapes that they do. Let’s start with the total cost curves.
Source: ReviewEcon
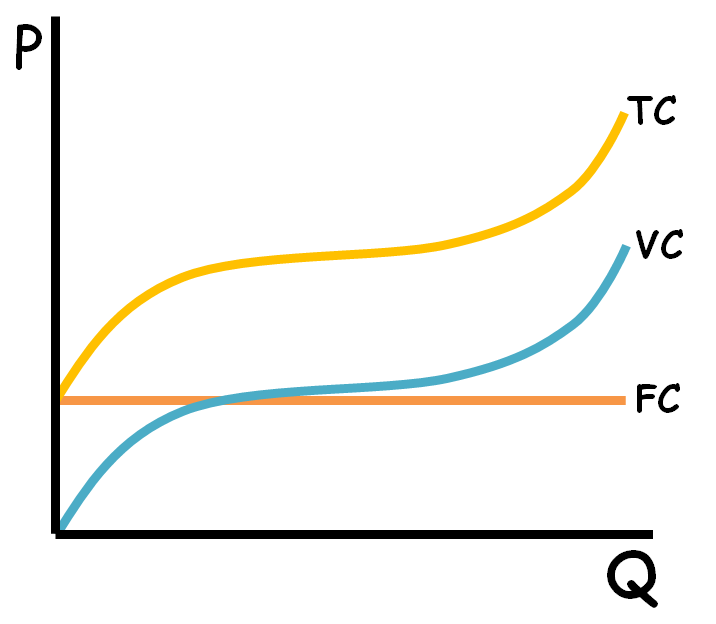
Total cost (TC), the sum of variable costs (VC) and fixed costs (FC) seems to increase at a decreasing rate at first; that is, it’s increasing but by less and less each time. Why? Because of specialization of resources, which increases marginal returns. At first, the firm is hiring new employees with different roles – whether it’s accountants, secretaries, lawyers, etc. But then, it seems that total cost begins to rise at an increasing rate towards the end where the graph gets steeper. That’s because of diminishing returns. Let’s revisit the bakery example; at first, each additional baker hired might have lots of value. Cost still goes up because it costs more to hire more, but not as much. But eventually, there are too many bakers and economic costs skyrocket. The variable cost curve follows the same shape as the total cost curve for that reason, but there is a constant vertical distance between VC and TC. That distance is equal to FC, which is a horizontal line because FC doesn’t change.
Source: Iris Franz
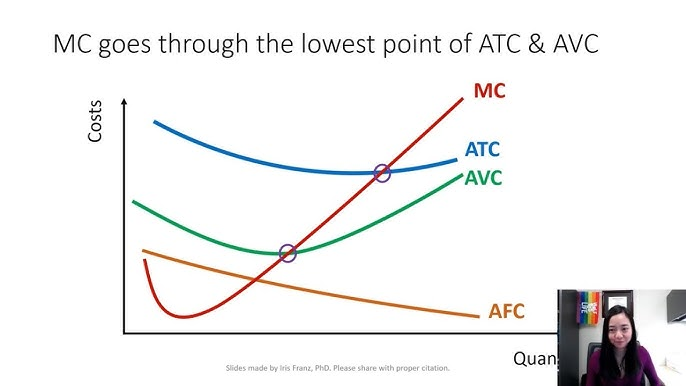
These are the marginal and average cost curves. Marginal cost (MC), which is just the slope of total cost, seems to decrease and then increase. You can draw a parallel between MC and TC; when MC decreases, TC increases at a decreasing rate. When MC increases, TC increases at an increasing rate. That’s basic calculus. Again, notice that the decrease in MC is because workers (or other inputs) are specializing, but then increases at higher outputs because of diminishing returns.
Average total cost (ATC) decreases initially and then increases for the same reasons as MC. Also notice that both ATC and average variable cost (AVC) intersect MC at their absolute minimums (the lowest point on those curves) – that’s key. The reasoning is simple: if the cost of producing the next unit (MC) is greater than the average, it will bring the average up. If it is less, it will bring the average down.
Average fixed cost (AFC) is always decreasing and eventually becomes asymptotic to the x-axis. Why? Well, since fixed costs don’t change, AFC is just the same denominator being divided by a greater and greater denominator as output increases – that’s the “spreading effect.”