Law of Demand
Now, let’s talk about the meat and potatoes of economics: supply and demand. The individual demand curve shows how much of a good an individual is willing and able to buy at a certain price point. The market demand curve shows the total amount of a good demanded by all consumers at various price points; it’s basically a sum of all individual demands, and that’s what we study in MICRO. Macro deals with aggregate demand, which sums all market demands.
The law of demand is the idea that raising the price of a good results in a smaller quantity demanded of such good and vice versa. That is, people are willing to buy more stuff when it’s cheap. That’s one reason that the demand curve – which has price on the y-axis and quantity on the x-axis – slopes downward.
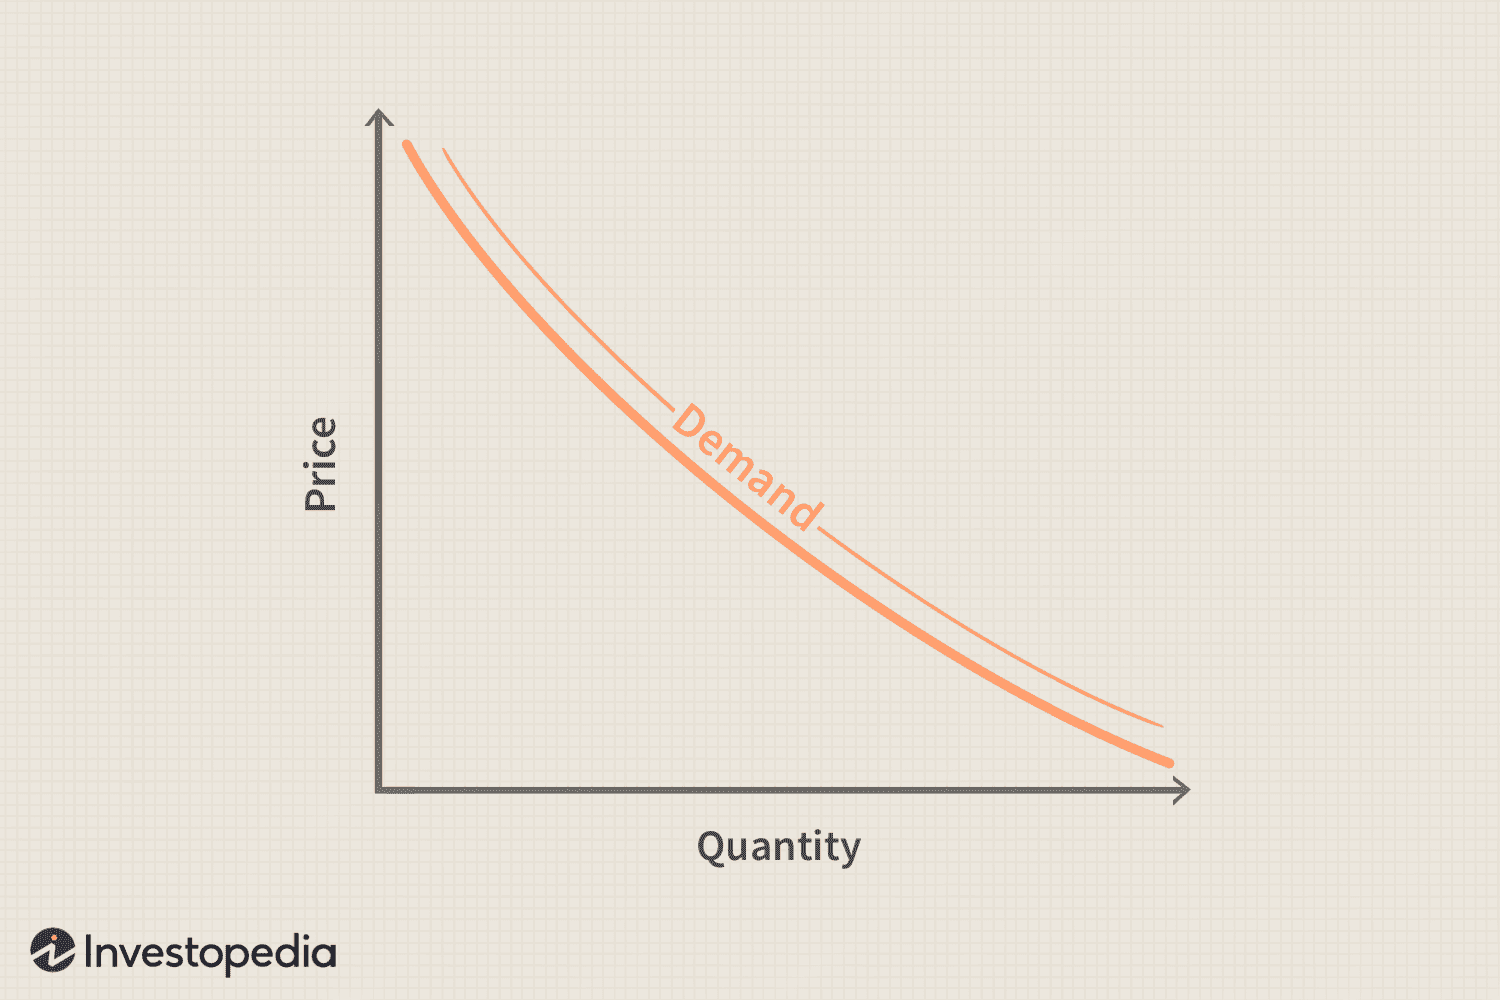
Source: Investopedia
Economists argue that the demand curve is downward-sloping for 3 reasons. First, the substitution effect: as the price of buying good X increases, consumers switch to other alternative goods that may be more affordable. Second, the income effect: as the price of good X increases, people can afford a lesser quantity of the good, so they buy less. Third, of course, there’s the law of diminishing returns: as consumers gain less and less utility from buying more of good X, they’re willing to pay less and less.
Importantly, people often confused changes in QUANTITY DEMANDED with changes in demand. They are entirely different. Quantity demanded changes if price changes; this refers to a specific point along the curve. If the overall demand for a good changes, that’s what creates a shift in demand, like moving from D2 to D1 below.
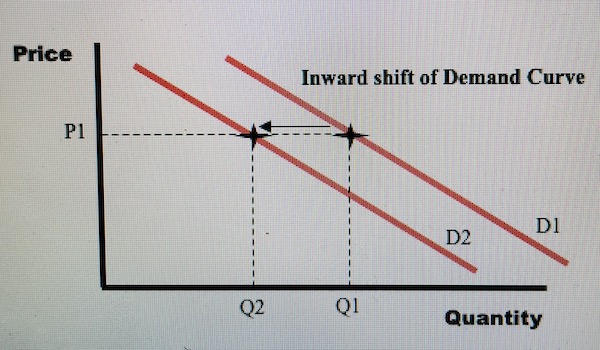
Source: Super Business Manager
Now that we know that shifts in QUANTITY demanded are solely determined by price, let’s discuss the causes of shifts in demand. There are 5 primary ones.
First, consumer income. For a normal good, demand increases as income increases. If people have more money, they’ll buy more goods – that’s pretty typical. For an inferior good, demand actually decreases as income increases. This is rare, but a good example is used clothing.
Second, related goods, of which there are two types. Imagine good A and good B are related to each other. For consumer substitutes, goods that can replace others, the price of good A increasing results in the demand for good B increasing. Think about it logically: if Pepsi suddenly becomes super expensive while Coke stays the same price, the demand for Coke would increase – it’s the substitution effect once more. For consumer complements, goods that are used together, the price of good A increasing results in a decreased demand for good B. Again, use logic: if hot dog buns become extremely expensive, the demand for wieners will decrease because people don’t want to make hot dogs if they can’t afford the buns.
Third, taste. This one’s rather simple. If a study came out tomorrow saying that the consumption of honeycrisp apples leads to heart disease, demand for honeycrisp apples would decrease.
Fourth, population. When the population increases, there are more consumers. When there are more consumers, there is generally a greater quantity demanded at each individual price point along a curve.
Fifth, expectations. Imagine your favorite clothing company announces a sale starting on Memorial Day Weekend. If you knew about the sale the week before, you wouldn’t want to buy clothes early; instead, you’d wait. That is, when consumers expect a future drop in prices, demand today decreases.